Robotic Palletizer Systems: Features, Working Process and
Robotic Palletizer Systems: Features, Working Process and Applications What I find splendidly mesmerizing is how an intricate dance by a...


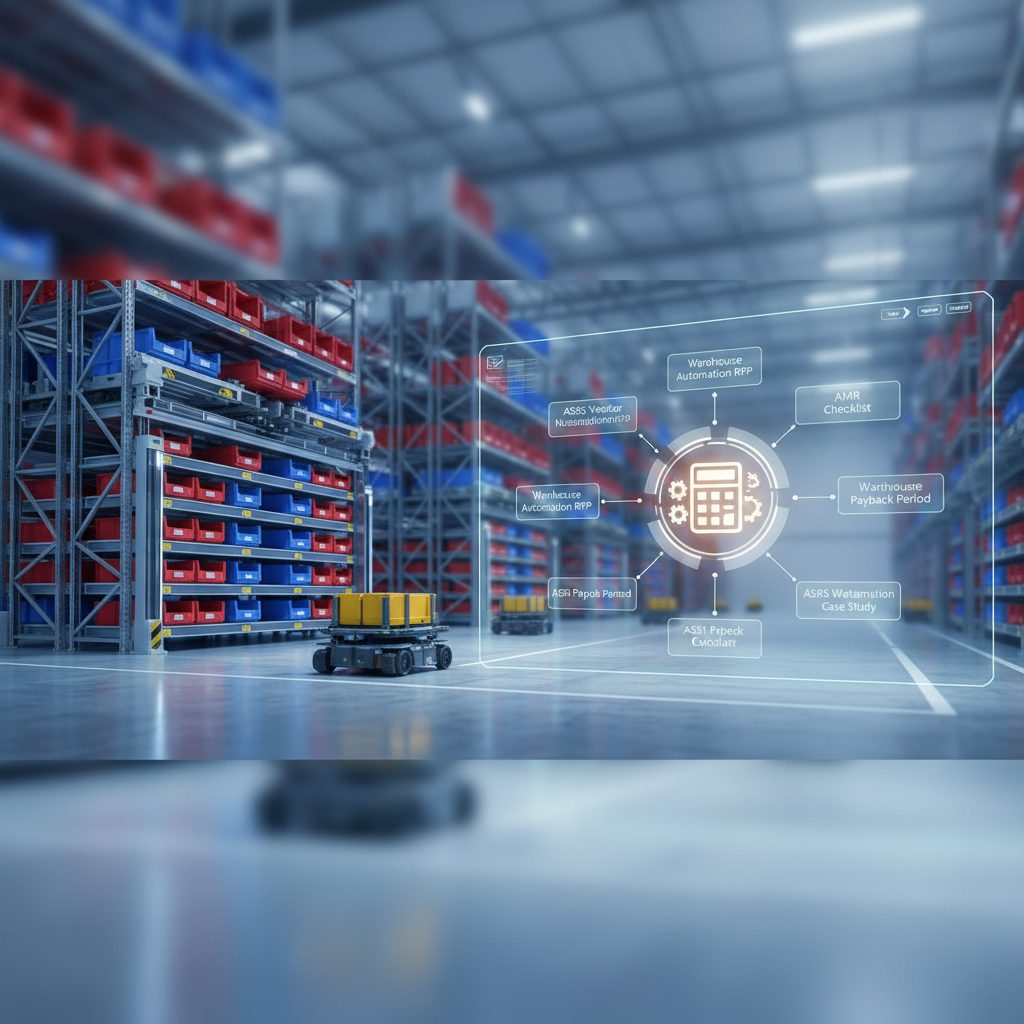
Warehouse automation fits most comfortably under the broad umbrella of technologies and systems that enhance operational efficiency, cut costs, and establish a platform for future growth. There are countless options for technology investment across a warehouse or distribution center, and a commonly applied metric for measuring the economic value of these expenditures is the payback period. That is the time it takes to recoup the cash spent on an investment, or when the cumulative cash flow crosses into positive territory. Using an ASRS payback period calculator instead of generic methods to determine those years can lead to a better understanding of the true value of your project.
Imagine you’re on the hunt for a new warehouse automation system. You get proposal A that costs $900,000 upfront with $45,000 in annual maintenance and labor savings of $12,000/month. After six months, you launch proposal B that requires $875,000 with $50,000 in annual maintenance and $10,000 labor savings. Suddenly it’s less clear which system is more cost-effective. Voilà! The estimated payback period fixes this by calculating how long it would take each solution to pay for itself. Looking at 6 and 6.75 months for proposals A and B you can now evaluate an apples-to-apples comparison.
Calculators are only as accurate as the data you feed them, but there’s no doubt they’re a useful scoping tool that can help quantify the business benefits of automation early in the deliberation process. That said, we recommend using a broad range of sources to sharpen your automation ROI estimate. Visit actual automated facilities to see how they’ve benefited and what they might have done differently. Talk with their operations people to get a sense of how your productivity might improve and what your labor setup might look like. Most importantly, bring your learning back to your own operations to imagine how the solution could affect your unique workflows.
A second reason is that ROI calculators force you to think through all the details. Warehouse automation operates in a complex system that might look slightly different in six months as you make other changes. Will your warehouse management system be able to keep up? How about your maintenance team? Depending on the findings, your calculator might wind up recommending additional investments as well. For instance, many DCs realize midway through their ROI calculation that they’ll need to hire a support engineer for a new automation product. Or they’ll need to increase spare parts inventory to accommodate future automation growth. If your ROI calculator points you in that direction, it’s better you know now, right?
You probably think I’m going to say “Return on investment”… which is certainly a big part of the story (and a part we’ll tell in more detail as we go). But, the thing is, what I enjoy most is the extent to which a solid business case calculator helps get-and keep- every key stakeholder on board. Your top management team is unlikely to be swayed by the enthusiasm of the pickers. Your finance people might trust the vendor, but they’ll expect to see the numbers for themselves. The IT department’s priority is integrating growing networks of autonomous robots, shuttles, and cranes into business systems, while HR is focused on how to get max value from the team among these new peers. How do you get all of these folks to sign up? You give them reliable numbers to work with.
To accurately determine the impact of automation, you’ll need to know the following about your operation. Labor costs: How much are you spending annually on wages, benefits, and overhead for the workers you aim to replace or redeploy? Throughput: How many orders do you process per hour or per shift? What is your pick accuracy rate? These baseline metrics are crucial in order to demonstrate improvement. In addition, you’ll need to determine the approximated cost of errors. This includes returns, re shipping, and customer service time. In our experience, many warehouses underestimate this cost.
When it comes to automation, gather specific quotes from vendors about what their solution includes. What is the cost for hardware, software, installation, training, and support? Don’t overlook any setup costs or ongoing support. Also, input the costs for integrations. It can be especially challenging to estimate these costs and the time that will be required. Be sure to add any needed interfaces that have to be developed on your end to connect the new equipment with your warehouse management system. Substantial costs can multiply quickly here. After you have vendor costs and prep and productivity cost estimates, you are almost ready to compare ROI. Consider one more factor first , what it will cost if your projections are too high.
The basic formula for payback period is simple: divide the total upfront cost by the annual savings. If your ASRS costs $3 million and saves $750,000 per year, your payback period is four years. But real world calculations are more complex. You need to account for the time value of money, ongoing maintenance, and potential revenue increases from faster order fulfillment. Some calculators use net present value or internal rate of return to provide a more nuanced picture of storage automation ROI.
You start by listing all costs. We’re talking equipment costs, installation costs, any training costs, and any modifications that might be required at your facility to accommodate the system. Next you add up all the expected annual savings. This could be less labor, fewer errors, and more productivity. Then you subtract expenses that will keep happening such as maintenance, new software updates, and additional energy usage. Take the net difference and divide the total cost by that amount, to give you your payback period, how long it will take for you to pay off your investment. The more you can predict and justify savings, the better and more accurate your payback analysis will be. For the initial cost assessment, that may be enough. The payback analysis is generally sufficient for containers, tuggers, and other easily defined AMR situations. If you want to get a bit more refined, you will want to apply a discount rate to these annuals, to adjust for the time value of money , and I’ll let an accountant or an ROI guru explain that in greater detail. But think of it this way: $100K of savings in year 5 might not be as valuable to you in the here and now as $100K in savings next year, right? So, discount that a bit to reflect what that future savings would be worth today, and you get the idea behind a discount rate , it lets you compare longer-term savings on an equal footing with short-term costs. Again, an accountant or a CFO can explain as much of that as you can stomach. If you’re looking at applications where you expect to be scaling this operation up over time, or your AMR solutions may evolve in the future, it does make sense to use a discount rate for your savings.
Factors That Influence Payback
Many factors can shorten or lengthen your warehouse automation payback period. Labor costs play the most important role. So companies located in high wage areas are more likely to have a shorter payback period because automation is replacing more expensive workers. The number of orders being processed matters as well. A facility processing 10,000 orders per day will recoup costs much faster than one handling 1,000. More accurate operations can also lead to a quicker return on investment. This is particularly true in industries with high return rates or where strict compliance to regulations is required. Low utilization, on the other hand, can lead to a slower payback. If your ASRS is sitting idle during off peak seasons, you’re not getting the most out of your investment.
How do ants, those seemingly simple-minded six-legged Dane Gudauskas is a freelance writer soldiers, build elaborate, airy, cathedra-like structures out of mud with a roof thatching so tight it excludes raindrops? Most of the time, humans can’t be bothered to figure it out. Nonhumans, meanwhile, perform similar feats at scales ranging from the nanometre to the nautical with no instruction manual in sight. Leafcutter ants, for example, can teach us a thing or two about how to optimize transportation of small goods shipments to and from a central location.
Conclusion
A payback period calculator, almost any automated version, doesn’t sound like it has much room for creativity, inspiration, or even personalization. It’s a tool you apply to do a specific job. But in the context of warehouse automation, it’s a framework that helps answer a fundamental question about a potential project. Is it worth doing from a financial standpoint? The beauty of a payback period analysis is that doesn’t only helps you answer that question. It helps you ask better questions to begin with. That automatically makes the project stronger. If feasible, it winnows out projects that would have wasted money and resource on something that isn’t going to deliver a result you need. And if its likely, it makes it easier to argue to others this is a project worth doing.

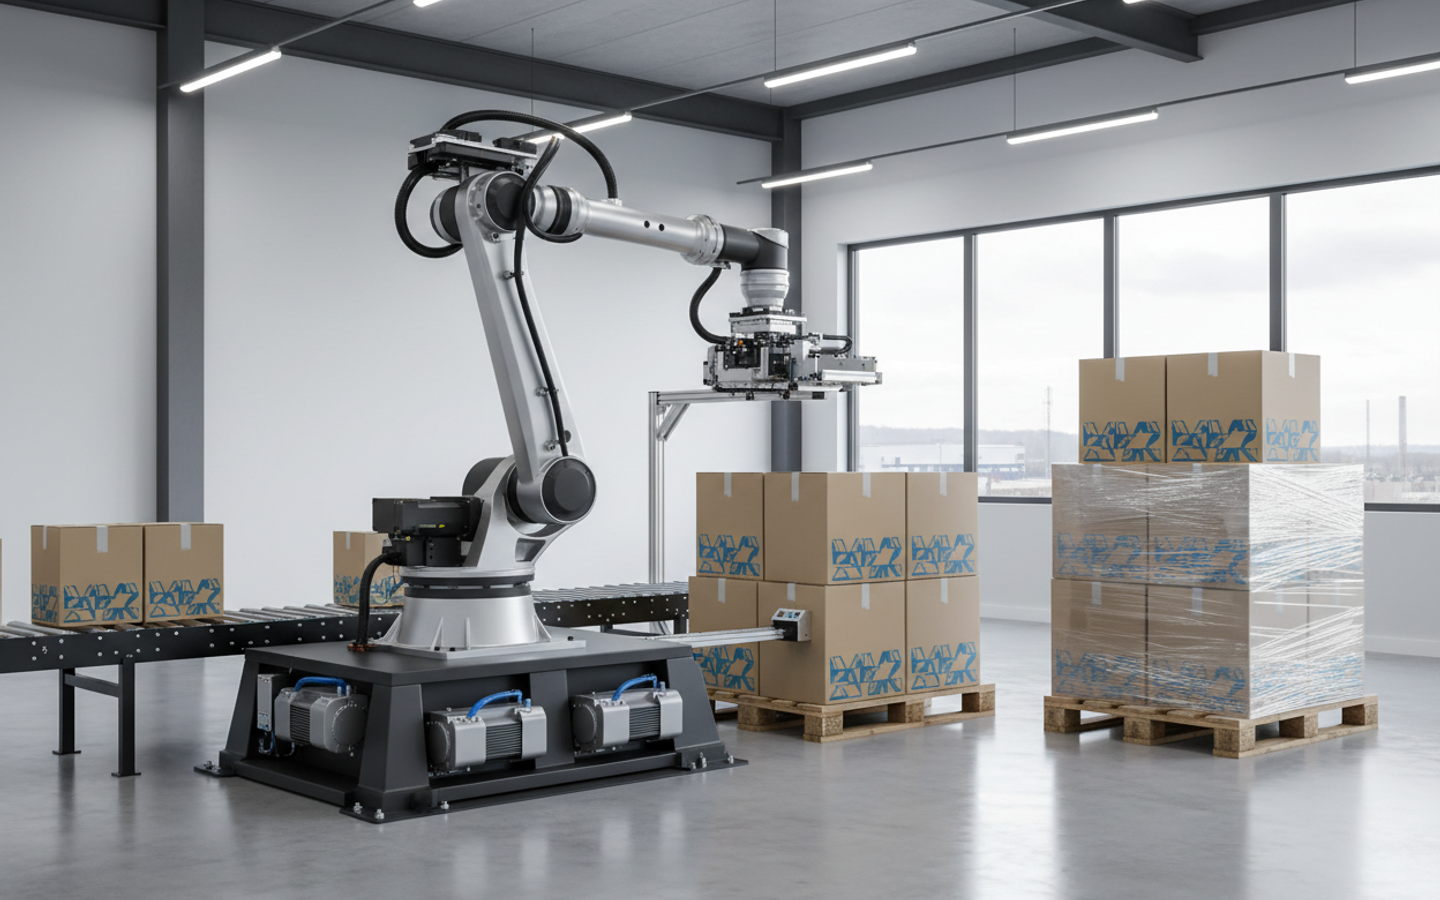
Robotic Palletizer Systems: Features, Working Process and Applications What I find splendidly mesmerizing is how an intricate dance by a...

ASRS Implementation Cost Guide Upgrade your warehouse in 2026 and you won’t just pay more for real estate and labor...

Simply put, warehouse management is the oversight of procedures, personnel, and operations. Consequently, unlike other functional divisions within a business,

To provide operational excellence, Armstrong Dematic leads the way towards innovative intralogistics and warehouse automation solutions. Our transformations are based on Industry 4.0 solutions.
Follow us on:


